Missouri Health Data
posted in: For All Missourians, Health & Safety, Tool, Youth & Family
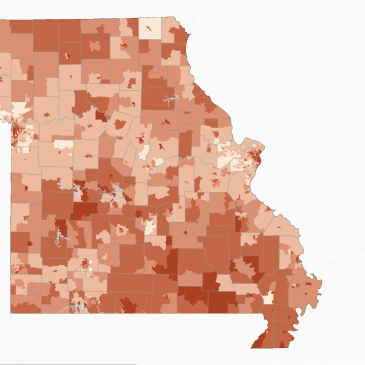
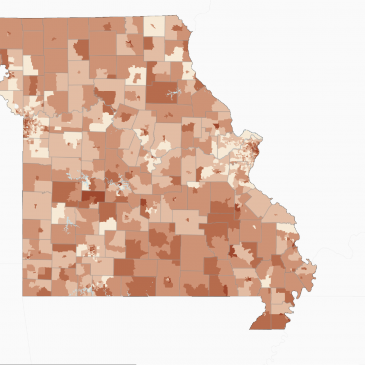
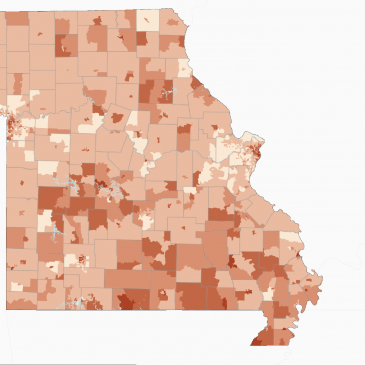
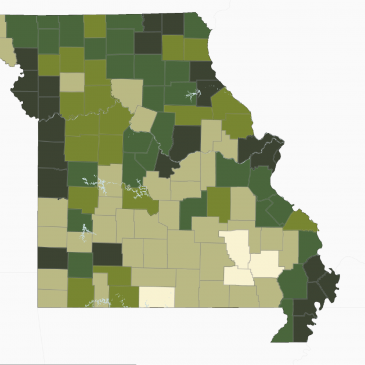
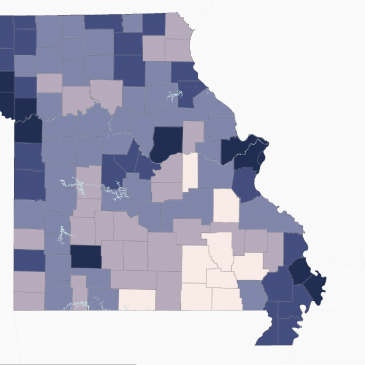
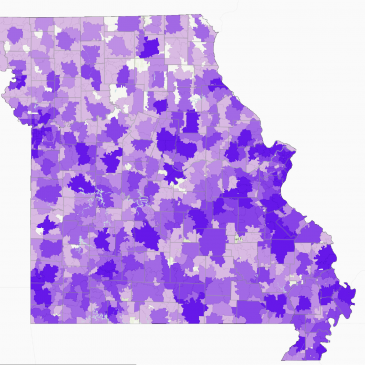
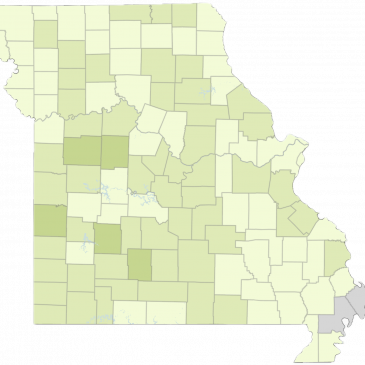
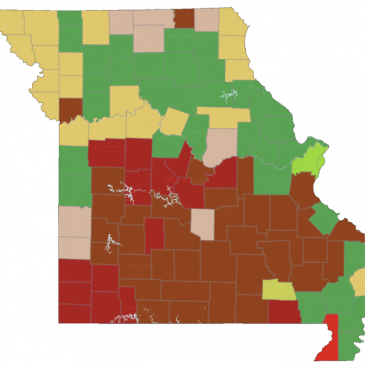
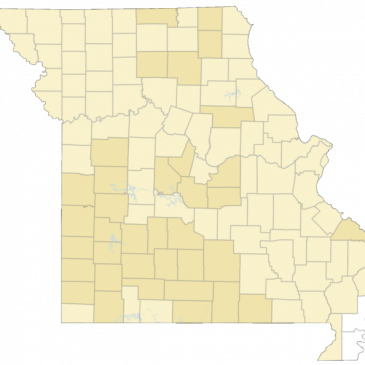
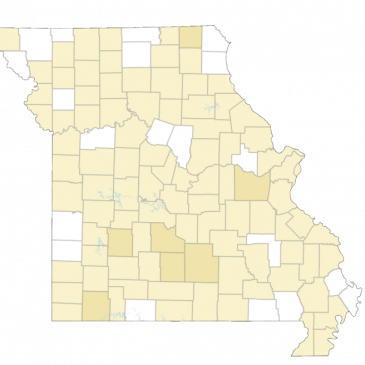
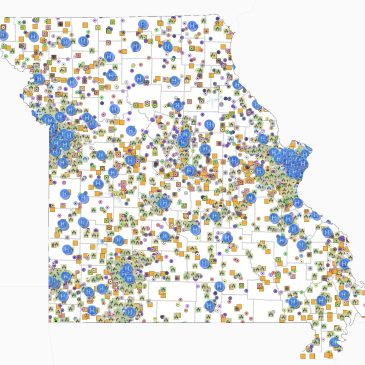
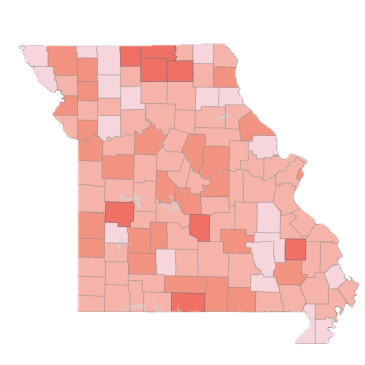
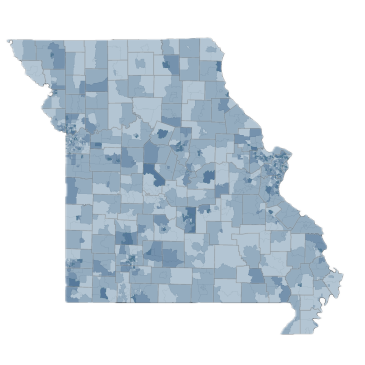
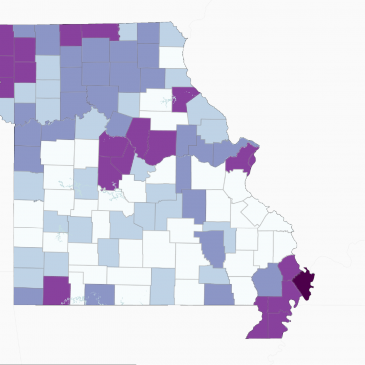
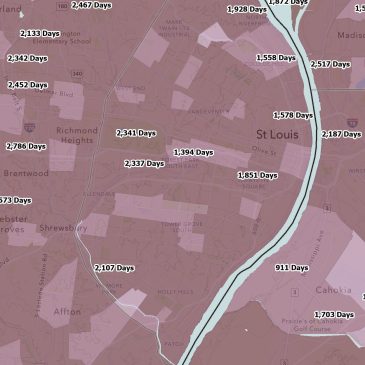
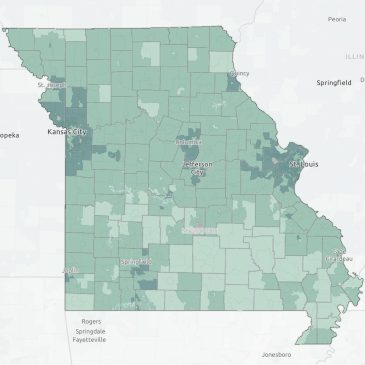
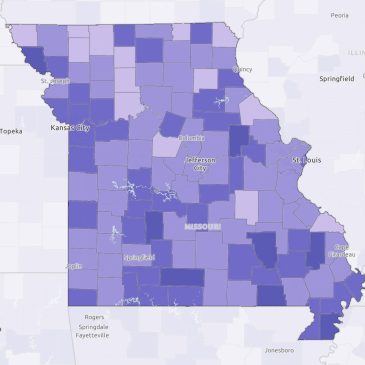
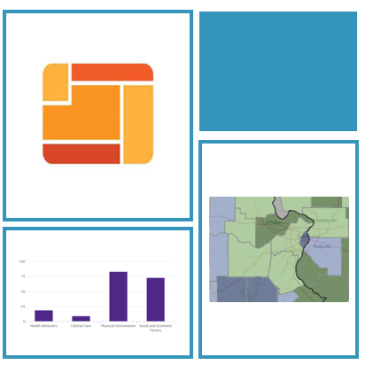
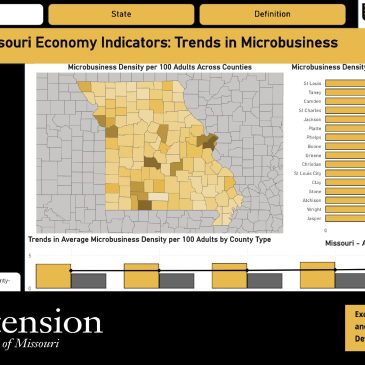
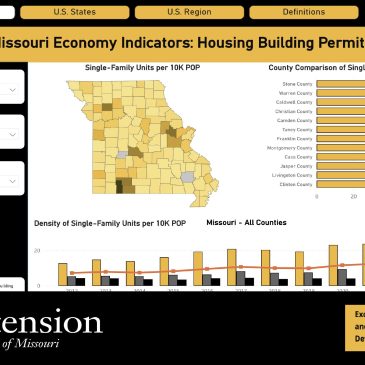
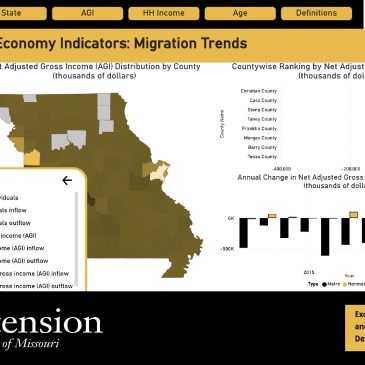
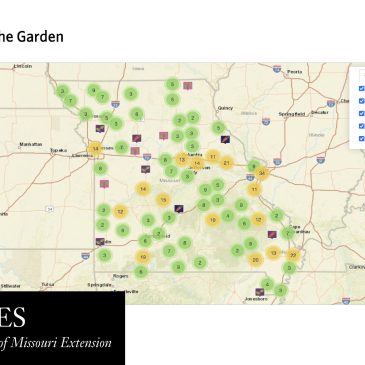
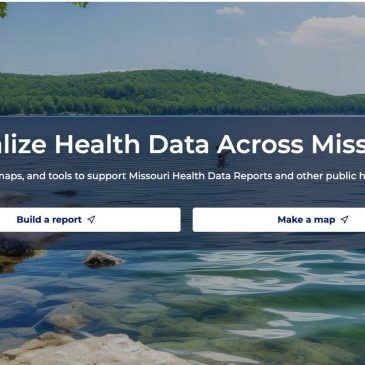
This data portal provides access to results from the 2016 and 2022 Missouri County-Level Studies (CLS) and the Behavioral Risk Factor Surveillance System (BRFSS) data from 2014-2024. Data can be accessed through the reporting interface and the Map Room.