Housing Insecurity
posted in: Business & Community, For All Missourians, For MU Extension, Map, Youth & Family
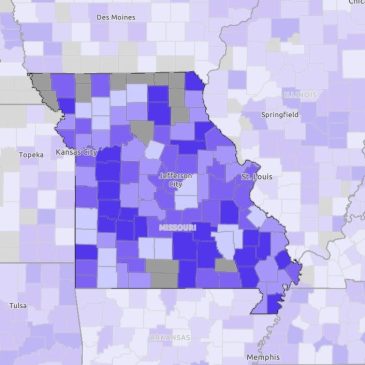
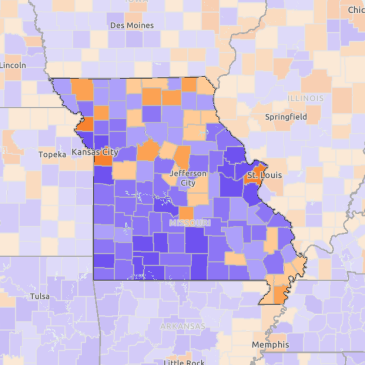
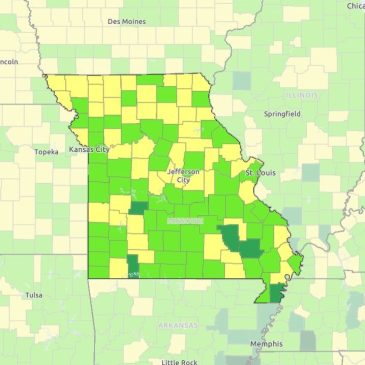
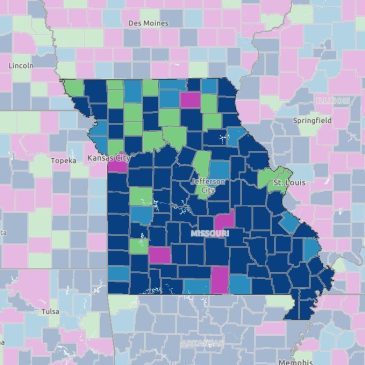
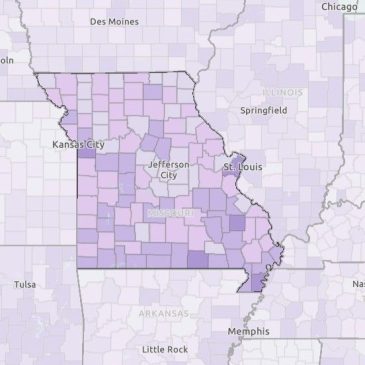
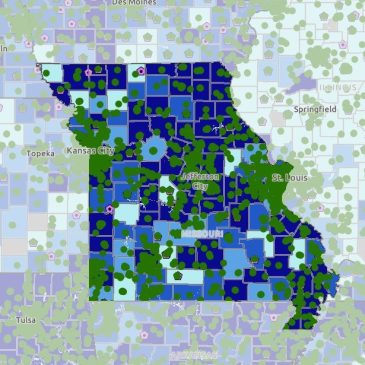
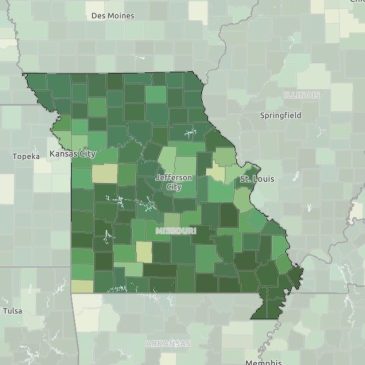
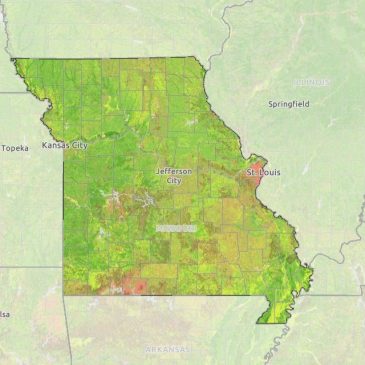
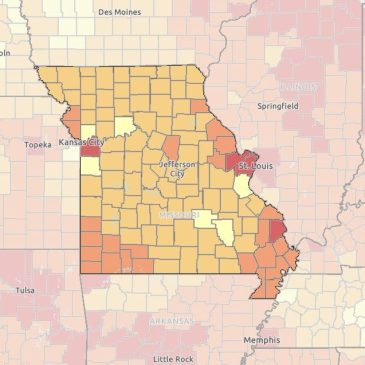
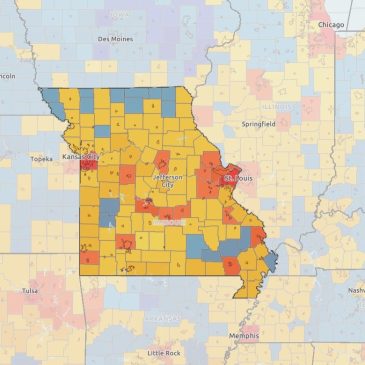
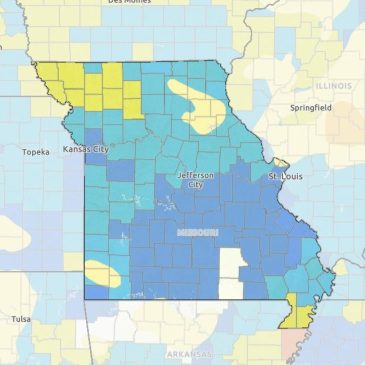
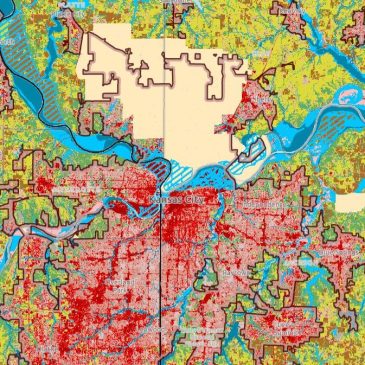
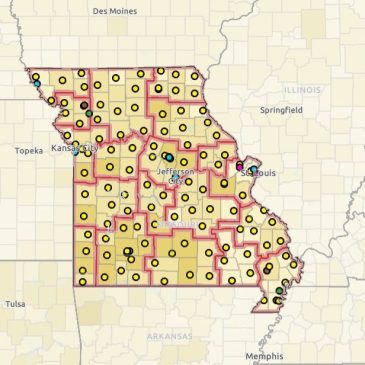
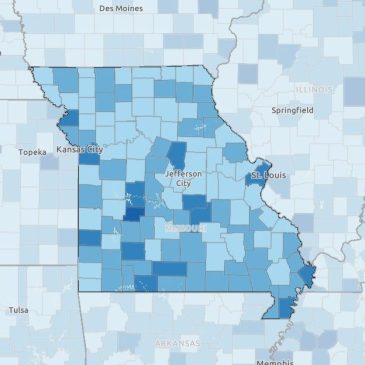
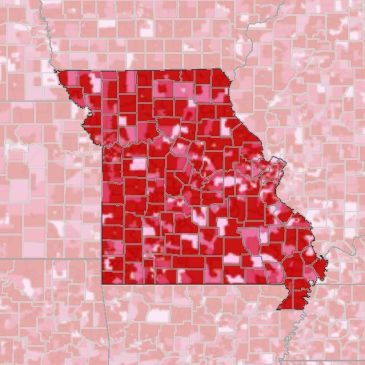
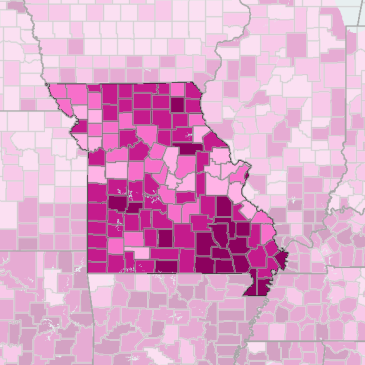
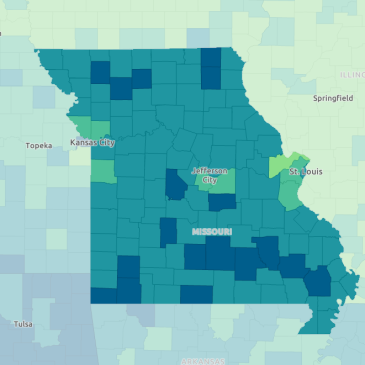
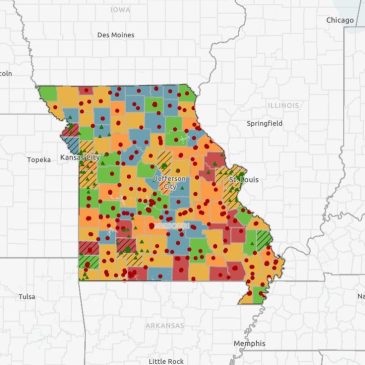
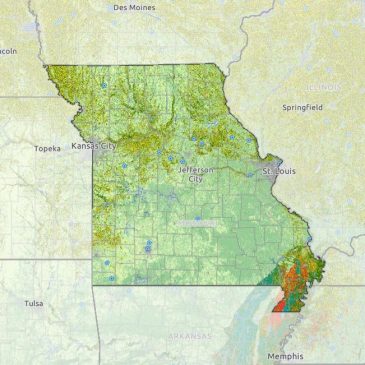
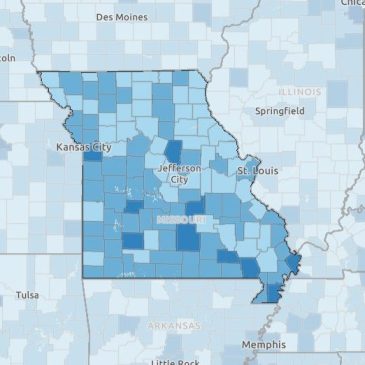
A lack of stable housing increases the risk of poor health outcomes and other hardships. This map shows layers related to cost-burdened households, available public housing, and the amount of income required to secure basic housing.